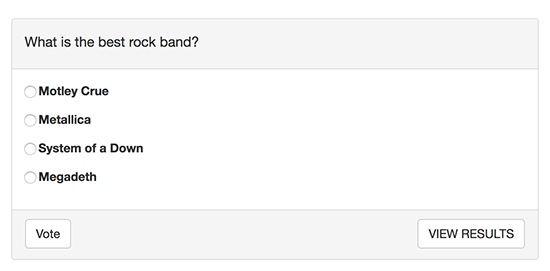
Polls are great because they allow people to respond with minimal effort, making engagement more likely. It takes a split second to answer a poll because the choices are already there – a bit like a multiple-choice exam question versus an essay question.
Polls are a great way to engage your audience and are a quick way to gauge opinion instantly. You can easily create polls and showcase their results in beautifully customized, animated charts.
Creating a Poll
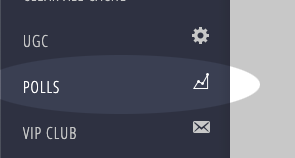
To begin creating a poll, navigate to the Polls section in the admin menu.
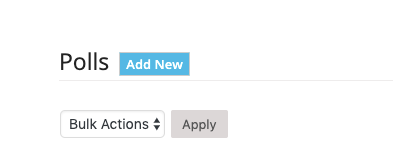
Click the Add New button on the Polls listing page at the top.
Poll Settings
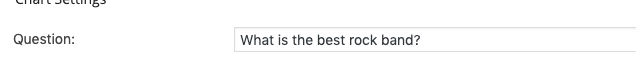
- Question: This is where you enter your poll’s question.
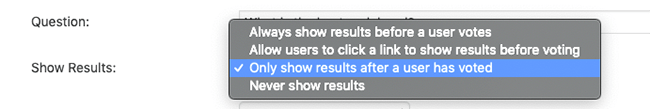
- Show Results: Choose when you want to display the poll results.
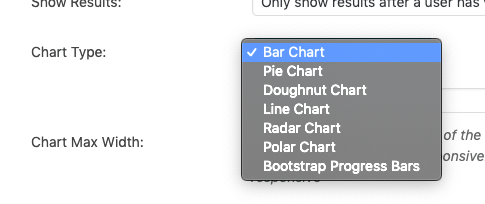
- Chart Type: Select the chart style you prefer for displaying the results.
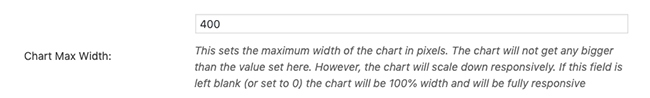
- Chart Max Width: Adjust the chart’s maximum width in pixels. Setting it to ‘0’ makes the chart fully responsive.
- Display Results as Percentage Values: Opt to display results as percentages rather than total vote counts.
![]()
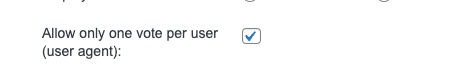
- Allow Only One Vote per User: Decide whether users can vote multiple times or just once.
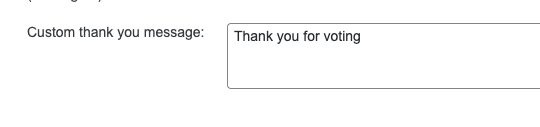
- Custom thank you message: Enter a custom or sponsored message that the user sees after they vote.
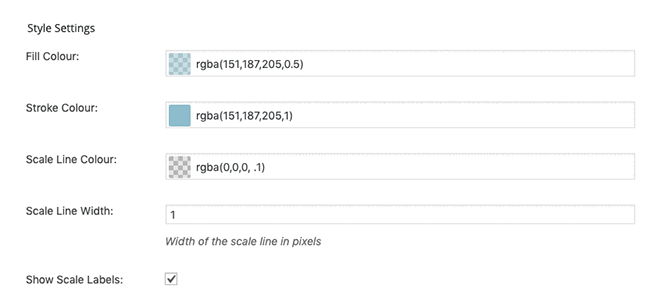
Style Settings
The next section is Style Settings. Here, you can customize the visual appearance of your chart.
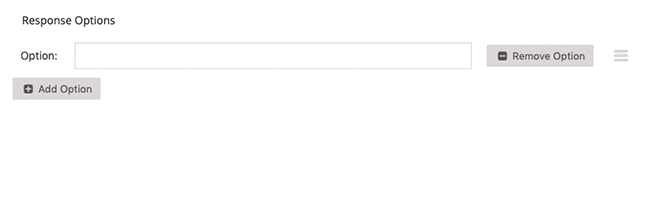
Response Options
After Style Settings, you’ll come across Response Options. This is where you add your data sets.
- Option Name: These are the answers to your poll question.
- Click Add Option for each additional choice you want to include in your chart.
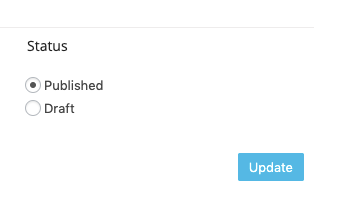
Scheduling and Saving Your Poll
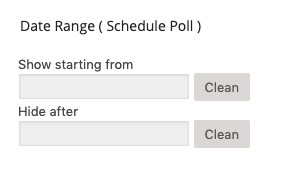
If you want your poll to be available only during specific time frames, you can achieve that easily. Select a start and end date in the Date Range box.
Once you’re satisfied with all your settings, click Update to save your poll.
Displaying a Poll
You can display your polls in posts or pages using shortcodes.
To publish your poll, edit it and copy the shortcode at the top of the settings. Then, paste it into the post or page where you want the poll to appear.
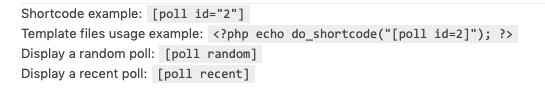
The appearance of the poll will be consistent regardless of where you choose to display the shortcode.
Displaying Results
If you wish to display poll results, you can do so in the Show Results field. Remember to also select the Chart Type you want users to see.
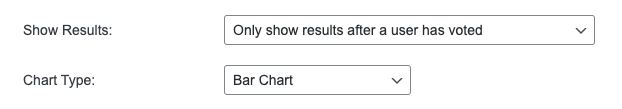
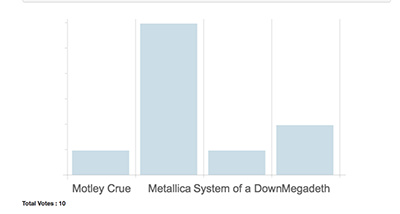
- User the examples set above, the user would see a bar chart after they voted.
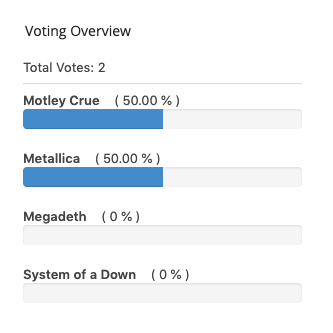
Viewing Results
To view your poll results, navigate to the poll you’re interested in and click Edit. Votes will be displayed in the right-hand sidebar.